KDD_PTAP
Interpreting Internal Activation Patterns in Deep Temporal Neural Networks by Finding Prototypes
Sohee Cho*, Wonjoon Chang*, Ginkyeng Lee and Jaesik Choi**
KAIST and INEEJI
* Both authors contributed equally to this research.
** Corresponding Author
KDD 2021 Poster
KDD 2021 Video
Deep neural networks have demonstrated competitive performance in classification tasks for sequential data. However, it remains difficult to understand which temporal patterns the internal channels of deep neural networks capture for decision-making in sequential data. To address this issue, we propose a new framework with which to visualize temporal representations learned in deep neural networks without hand-crafted segmentation labels. Given input data, our framework extracts highly activated temporal regions that contribute to activating internal nodes and characterizes such regions by prototype selection method based on Maximum Mean Discrepancy. Representative temporal patterns referred to here as Prototypes of Temporally Activated Patterns (PTAPs) provide core examples of sub-sequences in the sequential data for interpretability. We also analyze the role of each channel by Valeu-LRP plots using representative prototypes and the distribution of the input attribution. Input attribution plots give visual information to recognize the shapes focused on by the channel for decision-making.
Contribution
- Without handcrafted segmentation labels, our framework provides representative subsequences that activate channels of a convolutional neural network the most.
- We improve an existing greedy prototype selection method by constructing the Gram kernel matrix with feature values in neural networks instead of the simple radial basis function kernel with input values. The prototype results are more reasonable for time series as our method is less sensitive to the shift of subsequences.
- With our value-attribution score plots that show the distribution of input attributions for each prototype group, our framework helps to explain the shapes focused on by the channel for decision-making purposes.
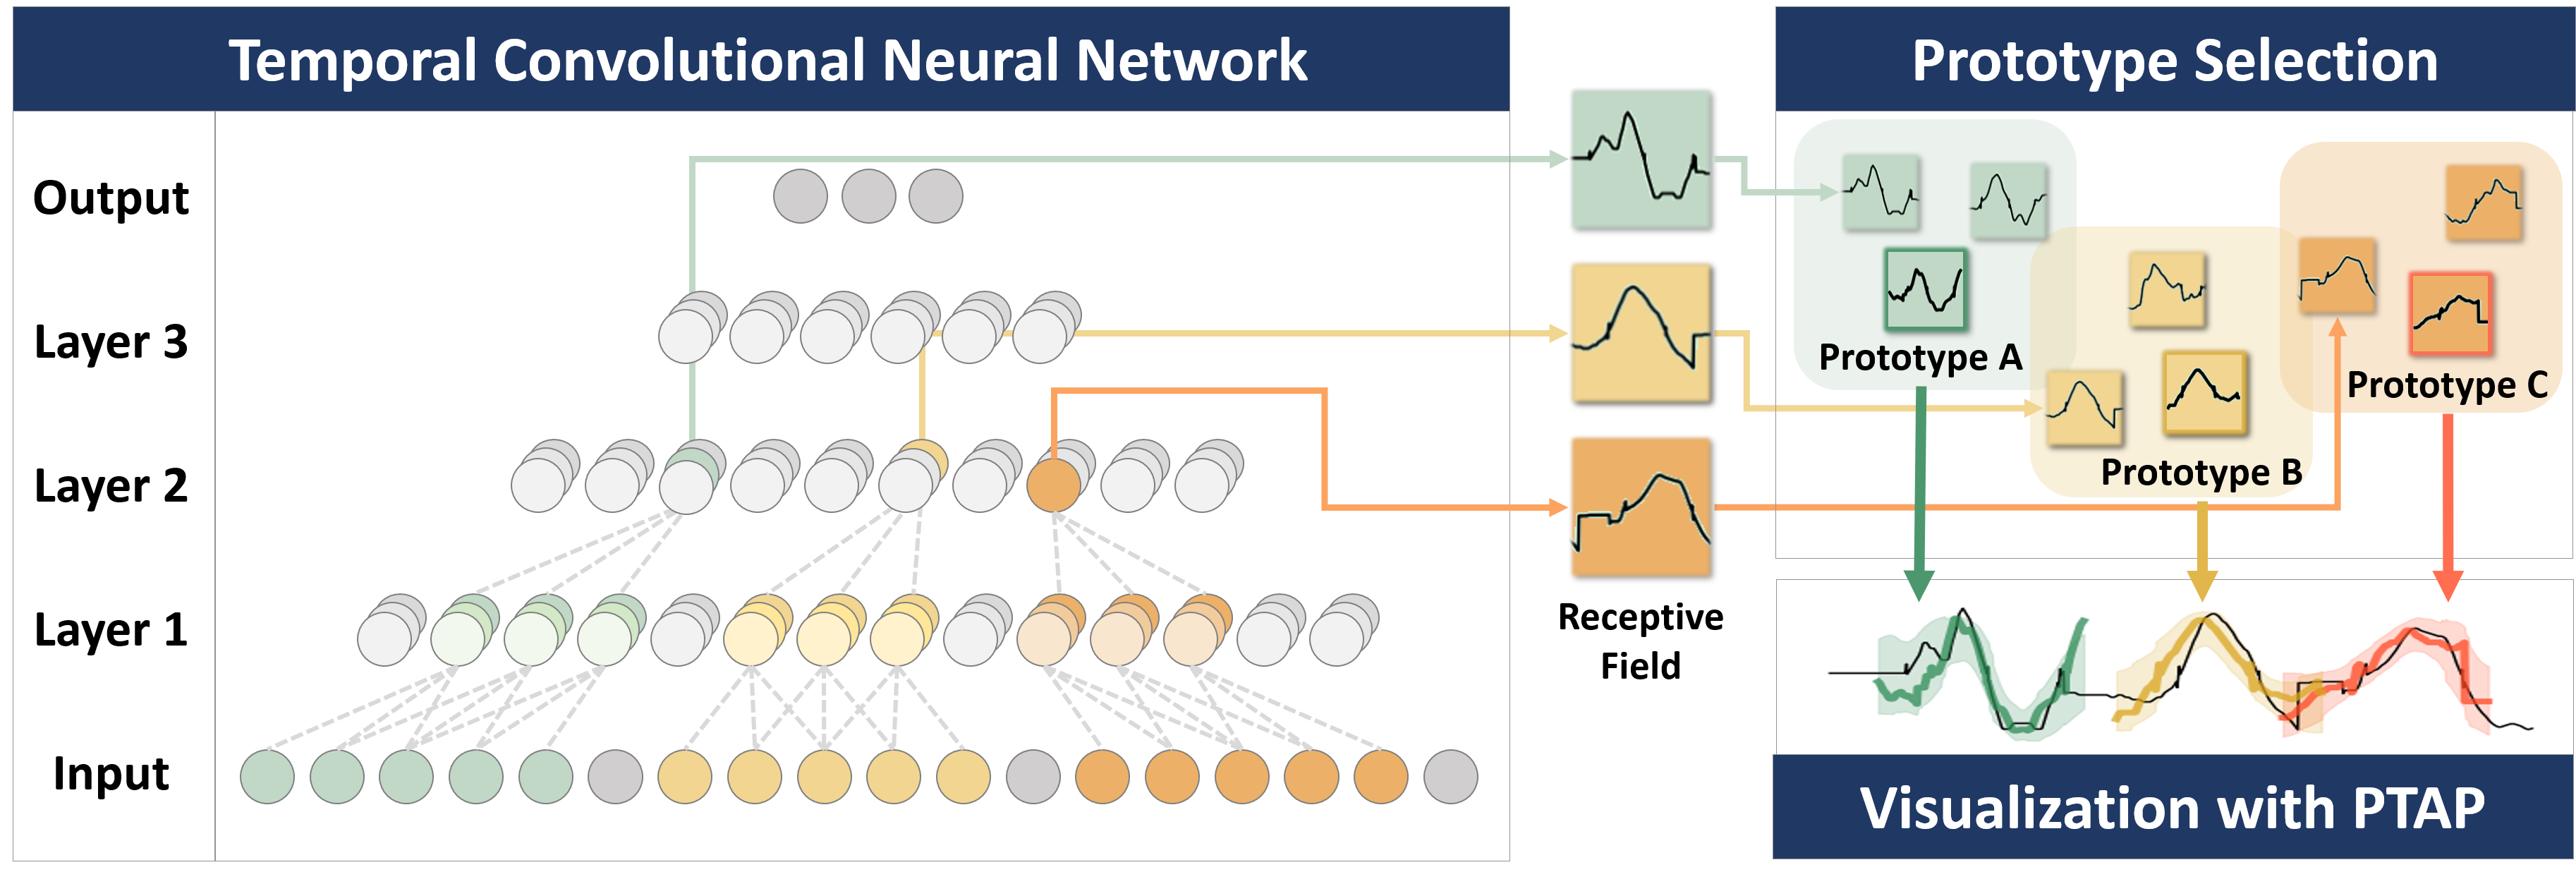
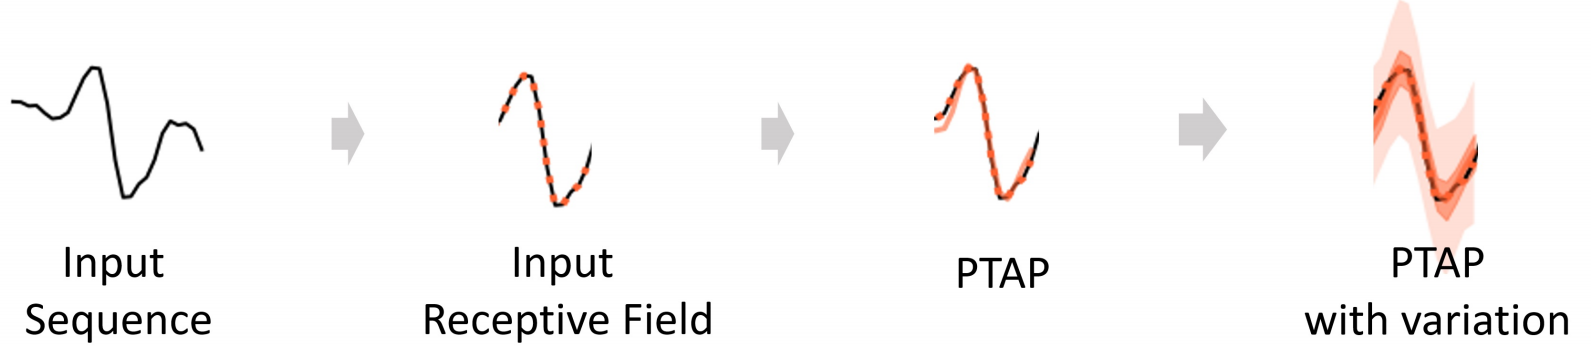
Prototypes of Temporally Activated Patterns
To visualize representative temporal patterns for given time series input, we define and extract patterns detected by neural network first. Then, we select a set of prototypes that reflects the entire distribution of patterns. Figure below briefly explains the visualization process. The black line is the original input sequence, the colored dotted line is the input receptive field, which means the detected part. The colored line shows the PTAP and the colored shadow denotes the variation in the patterns from the same prototype group. Since the input receptive fields of the channel activations can have overlapping areas, we remove some overlapped patterns for PTAP to illustrate the important patterns, which have high similarity to the subsequences, more clearly.
Improved Prototype Selection with the Gram Kernel Matrix
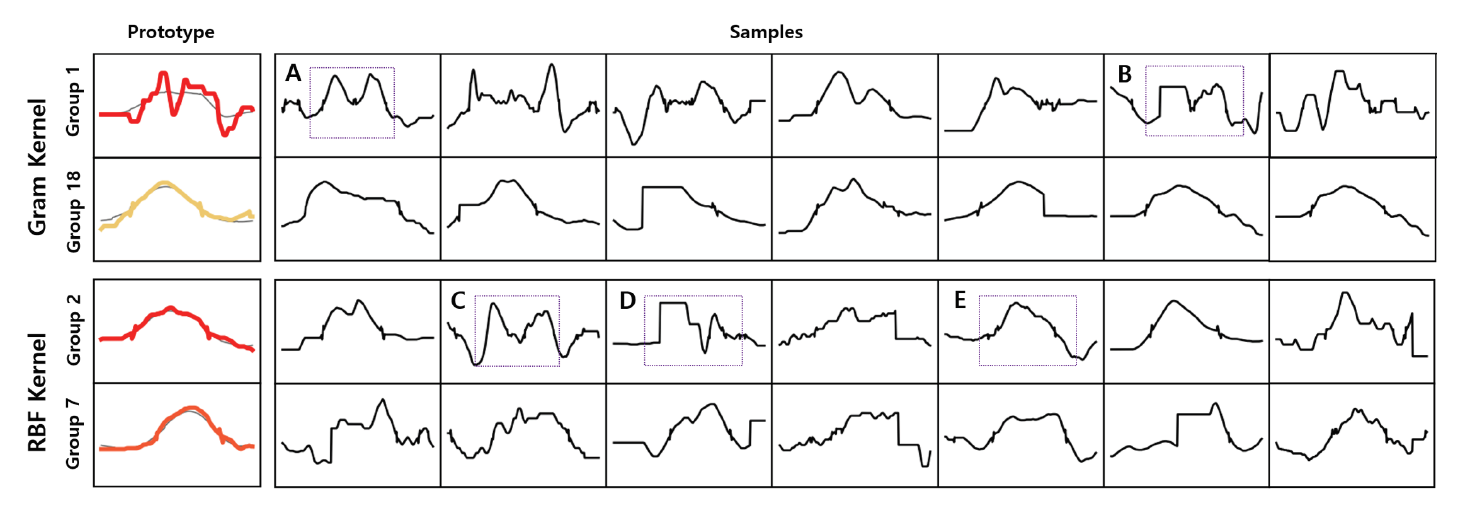
Prototypes extracted by the MMD method based on the Gram kernel and the rbf kernel in Uwave dataset. The first column shows the prototypes (representative samples) of selected groups and the remaining columns show which subsequences belong to the given prototype groups.We observe that the prototypes selected from the Gram kernel reflect the shapes of subsequences better since the Gram kernel is robust on the temporal shift of the pattern. Note that Group 2 and its temporally shifted one (Group 7) are extracted by the rbf kernel based method as distinct ones.
Sensitivity Analysis through Value-LRP plot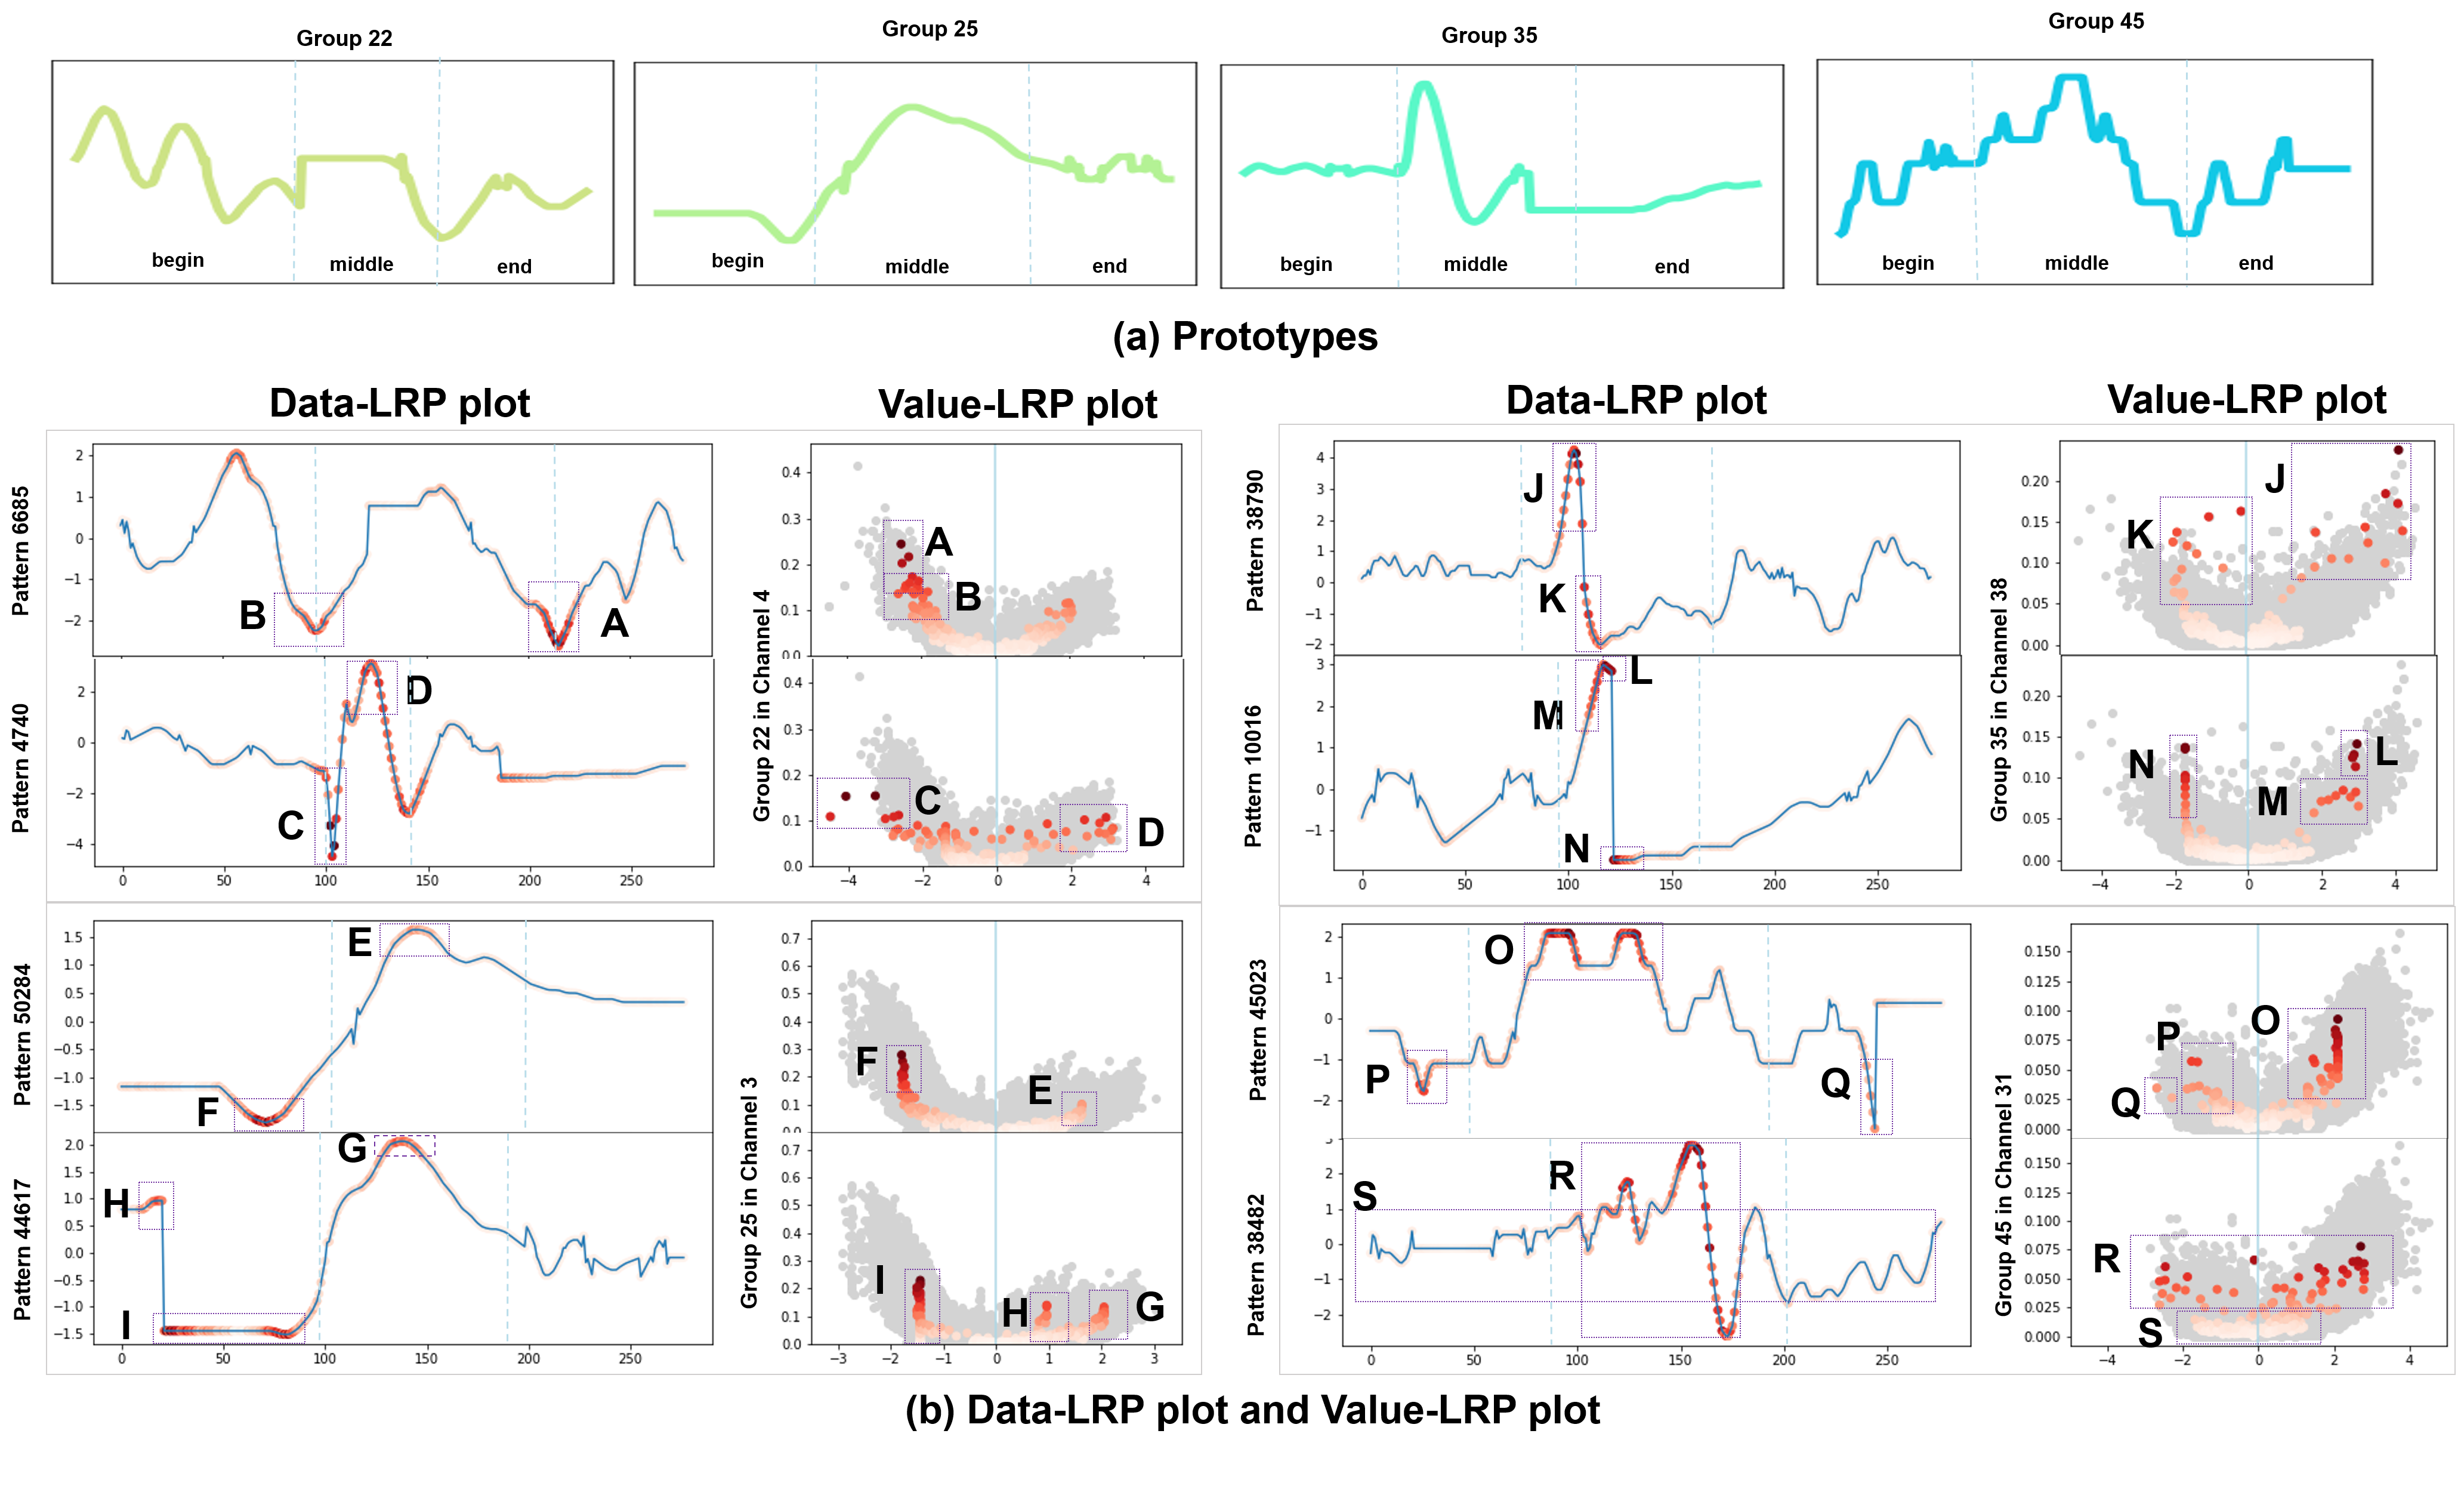
To demonstrate the benefits of our Value-LRP plot, we perform a sensitivity analysis with the Uwave dataset, as an example. The left column in (b) shows the Data-LRP and Value-LRP plot of Pattern 6685. Since Pattern 6685 belongs to Group 22 in Channel 4, the gray points in the Value-LRP plot refer to another pattern, i.e., pattern 4740. Pattern 6685 resembles its prototype in (a); the starting part has a fluctuating shape, the middle part has a stepped shape, and the end part has a small convex curve. The distribution in the Value-LRP plot usually shows upward curves. In general, values which are far from the mean have higher LRP scores, one example being A. However, there are many data and pattern specific cases well captured by our Value-LRP Plots. Pattern 4740 is similar to its prototype, Group 22, but its scales are quite different. Especially in the middle part, the length is shorter than that of the prototype, but the height is taller compared to the prototype. Moreover, C shows a drastic drop, causing the distribution to show a slight decrease in the Value-LRP plot.
Dataset
We use time series datasets of UCR repository ; Uwave (UWaveGestureLibraryAll), FordA and Starlight (StarlightCurves). And Smartphone Dataset for Human Activity Recognition (HAR) is a smartphone sensor dataset that records a person performing eight different activities. In this paper, we mainly use Uwave dataset, but other datasets show similar results.
Citation
Sohee Cho*, Wonjoon Chang*, Ginkyeng Lee and Jaesik Choi, Interpreting Internal Activation Patterns in Deep Temporal Neural Networks by Finding Prototypes, In Proceedings of the 27th ACM SIGKDD International Conference on Knowledge Discovery & Data Mining (KDD ’21).
(*first two authors contributed equally.)
Bibtex
@inproceedings{cho2022interpretation,
title={Interpreting Internal Activation Patterns in Deep Temporal Neural Networks by Finding Prototypes},
author={Sohee Cho Wonjoon Chang Ginkyeng Lee and Jaesik Choi},
booktitle={In Proceedings of the 27th ACM SIGKDD International Conference on Knowledge Discovery & Data Mining (KDD ’21)},
year={2021},
}
Acknowledgment
This work was supported by Institute for Information & communications Technology Planning & Evaluation (IITP) grant funded by the Korea government (MSIT) (No.2017-0-01779, XAI and No.2019-0-00075, Artificial Intelligence Graduate School Program (KAIST)).